Diagram Libraries and Tools
Visualizing code is something I spend a lot of time thinking about. I want better tools for it, because while I prefer the ability to code things with text, I also want to be able to see relationships between components.
So, for your sake, dear reader, I went down a rabbit hole this weekend.
Shoulders of Giants
Skip this section if you're not interested in historical context.
While not the first, the granddaddy standard is UML, the Unified Modeling Language. As best I can tell, it's really the first system that set out to really standardize some of the concepts of making diagrams and visualizations and gained widespread adoption.
However, it had a pretty fatal flaw for engineers - there was no standardized way of representing the diagram outside of modeling software. If you search "UML Syntax," you'll get a lot of blogspam about what UML is, as that's what it specifies - the kinds of diagrams, the ways the relationships are built within a given diagram, and where they're best used. It's incredibly important, but when you already have an idea of the diagrams you want to make, or you want to iterate quickly (as many programmers wish to), it leaves much to be desired.
Similarly, the DoDAF (Department of Defense Architectural Framework) was developed around the same time, and while it's not aimed solely at software, there are some components that can be used to help diagram a system and understand how they fit together. But, like most things the DoD produces, it's built to scale from billion-dollar programs to trillion-dollar programs, and carries a lot of baggage along with it (nevermind the DoD designation).
I'm going to skip over a lot of time, but some notable things if you want to investigate more include the C4 Model, Graphviz and their DOT graph description language, and things like Microsoft Visio.
Somewhere in the 2010s, though, there was an explosion of web-based tooling for a variety of software applications. New tools like Draw.io, Lucid, Gliffy, and others came out that offered "more" ways of making diagrams easily and sharing them and made them more accessible by being on the web as well as being embeddable.
In my estimation, towards the end of the '10s, there was a push towards putting more and more things in source control. Git ate the world and became so ubiquitous that people regularly propose building old SVN and CVS features on top of Git without a hint of irony.
Which brings us more or less to today.
Modern Tools
Along with the explosion of web tools started a second (third?) wave of software tooling. I mentally lump things like Squarespace, Figma, and Webflow together - tooling that made building software much, much more accessible, and helped design and development teams work more closely together.
I also think that portions of the web have become more accessible, and so people outside of the (recent) historical norm for software engineers have contributed to the field and we're seeing more diverse ways of thinking.
Alright, so what do we have?
Mermaid
Mermaid is the "new" (first commit in 2014) hotness. Its goal was to take the Markdown paradigm and apply it to diagrams, and it definitely delivers. It provides support for a number of different diagram types out of the box and is batteries-included and helpful, but stays out of your way.
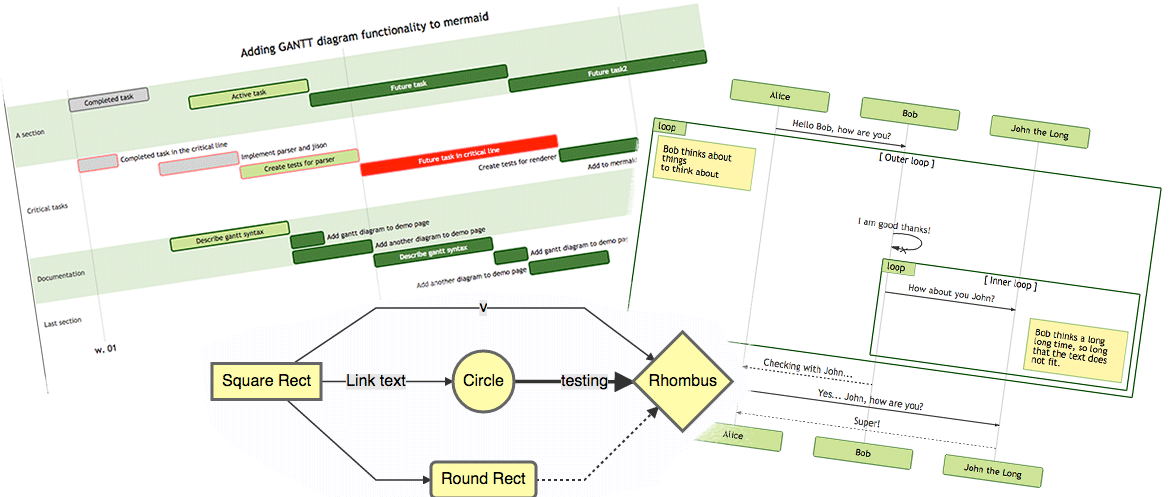
It's easy to use, easy to embed, and a lot of the syntax makes sense. They've put effort into the usability. The syntax is clean and intended to be read without too much specialized knowledge to make it accessible for non-experts. Things like visual arrows --> and relationships Alpha: Beta contribute to its readability.
But the nature of being batteries included comes at a cost, and if you want to build a diagram type they don't have, you're out of luck. The particular addition I was looking for was more detailed modeling in their Entity Relationship diagrams, to utilize as a database schema visualizer (you can do it anyway), but I wanted the specific attributes pointing to their specific foreign-referenced attributes.
The community is robust and the OSS project is now supported by Mermaid Chart, founded by some of the developers, so I'm hopeful we'll see it stick around for a few years.
Try it out at https://mermaid.live/, it really is slick and easy to use.
D2(Lang)
On the opposite end of the spectrum is D2Lang (or just D2). Instead of providing you with a bunch of diagram types, it dumps a bunch of building tools in your lap and goes, "You figure it out." It's extremely flexible and they have a number of examples on their site for various kinds of diagrams, but if Mermaid is like Python, D2 is much more like C.
This makes it easy to initially learn, but much more complex to use. If you want your diagram to look pretty, you're going to have to put the time into styling it yourself. It's more like CSS and while this make is very powerful, it can also make the learning curve rather more difficult.
They do have a playground at https://play.d2lang.com where you can try out different styles, see some snippets, and even test which layout engine you use. It's great if you're getting frustrated and want to be more specific with what your diagrams look like.
GraphViz
GraphViz has been around for awhile, and has the battle scars to prove it. It's got bindings to so many languages that it even has bindings to MediaWiki. There's a decent chance you may already have it installed in some form if you're on Linux.
It also has a number of layout engines if you're looking to customize that, and the list of potential output formats is so big they generated a diagram to show you what plugins can generate what types.
I've almost certainly used GraphViz before and I'm liable to again, for integration with other projects. However, for generating diagrams "by hand," I think I'm going to stick with the simpler stuff for now.
Other Tooling
- Kroki - A unified API for making diagrams using a number of different plugins.
- Obsidian Canvas - "Recently" added to Obsidian, it doesn't quite work for the purpose of auto-generating diagrams, as it does have a JSON representation, but you're not expected to build your diagrams in it.
- Anything related to the phrase "Mind Maps" - There's a whole slew of pretty-decent tools, both open source and paid, for mapping out concepts and organizing them in different ways. They are intended for a different purpose, but can frequently be a good starting place for any given diagram.
Closing Thoughts
It's exciting to see a lot more "competition" in the open source space for different diagrams and styles and the ways to build them. I'm definitely going to continue watching the space and probably integrate these all into my work in various ways.
Did I miss one? Let me know! Drop me a line at me@esras.blog.